Pandas DataFrame head, tail, at, iat#
In this class, we learn how to use DataFrame.head() and DataFrame.tail() functions to select top and bottom rows of the Pandas DataFrame respectively. Also, learn DataFrame.at() and DataFrame.iat() functions to access a specific value in the DataFrame.
How to use DataFrame.head() function#
This function is used to see the first n rows in the DataFrame. It is beneficial when we have massive datasets, and it is not possible to see the entire dataset at once.
It takes input as the number of rows to be displayed from the top. The default value is 5.
Syntax:
DataFrame.head(n=5)
Example:
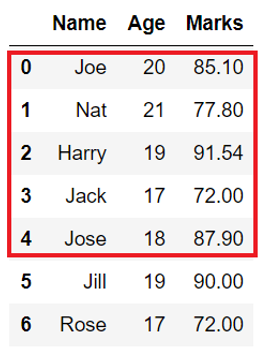
In the below Student DataFrame with columns like Name, Age, and Marks. If we apply DataFrame.head() function, we can see that only the first five rows are displayed.
import pandas as pd

student_dict = {'Name': ['Joe', 'Nat', 'Harry','Jack','Jose','Jill','Rose'],
                'Age': [20, 21, 19,17,18,19,17],
                'Marks': [85.10, 77.80, 91.54,72,87.9,90,72]}

# create DataFrame from dict
student_df = pd.DataFrame(student_dict)

# display first 5 rows
topRows = student_df.head()
print(topRows)
    Name  Age  Marks
0    Joe   20  85.10
1    Nat   21  77.80
2  Harry   19  91.54
3   Jack   17  72.00
4   Jose   18  87.90
Select top n rows in pandas DataFrame#
When we want to see a smaller section of data, we can use the function DataFrame.head() and pass a parameter as the number of rows to display from the top.
Example:
In the below example, after we apply the DataFrame.head(3) function, only the first three rows of the DataFrame are displayed.
# display first 3 rows
topRows = student_df.head(3)
print(topRows)
    Name  Age  Marks
0    Joe   20  85.10
1    Nat   21  77.80
2  Harry   19  91.54
Select top rows except for last n rows#
When we have a vast DataFrame, and we want to see all the rows except for the last n rows, we can pass the negative value as a parameter to DataFrame.head().
Example:
In the below example, if we want to display all the rows except the bottom two rows, we can use DataFrame.head(-2) function.
import pandas as pd

student_dict = {'Name': ['Joe', 'Nat', 'Harry','Jack','Jose',"Jill","Rose"],
                'Age': [20, 21, 19,17,18,19,17],
                'Marks': [85.10, 77.80, 91.54,72,87.9,90,72]}

# create DataFrame from dict
student_df = pd.DataFrame(student_dict)

# display rows except bottom 2 rows
topRows = student_df.head(-2)
print(topRows)
    Name  Age  Marks
0    Joe   20  85.10
1    Nat   21  77.80
2  Harry   19  91.54
3   Jack   17  72.00
4   Jose   18  87.90
Select top rows from multi-index DataFrames#
When Python pandas DataFrame has multiple row index or column headers, then are called multi-level or hierarchical DataFrame. As we have discussed in the above section, we can use the DataFrame.head() function on multi-index DataFrames to display the top rows.
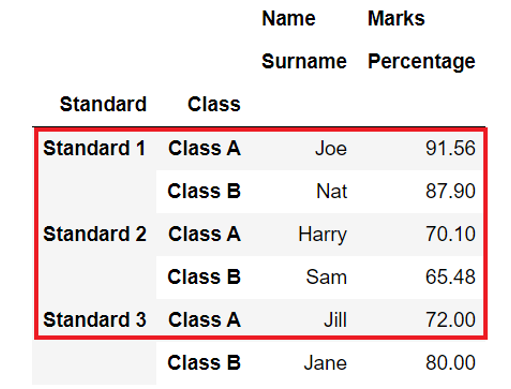
The below diagram shows hierarchical DataFrame of Student data with two-column headers where column labels Name and Marks are at level 0 and Surname and Percentage at level 1. Similarly, two-row indexes are index ‘Standard‘ at level 0 and Class at level 1 of the DataFrame.
Example:
The below example shows how to create such DataFrame and display top rows rather than the whole DataFrame.
import pandas as pd

index = pd.MultiIndex.from_tuples([('Standard 1', 'Class A'), ('Standard 1', 'Class B'),
                                   ('Standard 2', 'Class A'), ('Standard 2', 'Class B'),
                                   ('Standard 3', 'Class A'), ('Standard 3', 'Class B')],
                                  names=['Standard', 'Class'])

columns = pd.MultiIndex.from_tuples([('Name', 'Surname'),
('Marks', 'Percentage')])

# create multi-index dataframe
student_df = pd.DataFrame([('Joe', 91.56), ('Nat', 87.90),('Harry', 70.10),
                           ('Sam', 65.48), ("Jill", 72), ("Jane", 80)],
                          index=index, columns=columns)

topRows = student_df.head()
print(topRows)
                      Name      Marks
                   Surname Percentage
Standard   Class
Standard 1 Class A     Joe      91.56
           Class B     Nat      87.90
Standard 2 Class A   Harry      70.10
           Class B     Sam      65.48
Standard 3 Class A    Jill      72.00
How to use DataFrame.tail() function#
We can use the DataFrame.tail() function to display the last n rows of the DataFrame. Like the head function, this function is used when we want to view a smaller section of the entire DataFrame.
It takes input as the number of rows to be displayed from the bottom. The default value is 5.
Syntax:
DataFrame.tail(n=5)
Example:
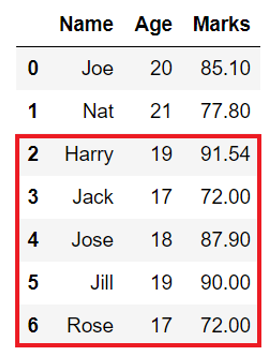
In the below Student DataFrame with columns like Name, Age, and Marks. If we apply DataFrame.tail() function, we can see that only the bottom five rows are displayed in the output.
import pandas as pd

student_dict = {'Name': ['Joe', 'Nat', 'Harry','Jack','Jose',"Jill","Rose"],
                'Age': [20, 21, 19,17,18,19,17],
                'Marks': [85.10, 77.80, 91.54,72,87.9,90,72]}

# create DataFrame from dict
student_df = pd.DataFrame(student_dict)

# display the bottom 5 rows
bottomRows = student_df.tail()
print(bottomRows)
    Name  Age  Marks
2  Harry   19  91.54
3   Jack   17  72.00
4   Jose   18  87.90
5   Jill   19  90.00
6   Rose   17  72.00
Select bottom n rows in pandas DataFrame#
When we want to see a smaller section of data from the bottom of the DataFrame, we can use the function DataFrame.tail() and pass a parameter as the number of rows to display from the bottom.
Example:
In the below example, after we apply the DataFrame.tail(3) function, we see that only the last 3 rows of the DataFrame are displayed.
bottomRows = student_df.tail(3)
print(bottomRows)
   Name  Age  Marks
4  Jose   18   87.9
5  Jill   19   90.0
6  Rose   17   72.0
Select bottom rows except for first n rows#
When we want to see our entire dataset except for the first few rows, we can use DataFrame.tail() function and pass the negative value as a parameter to it.
Example:
In the below example, if we display all the rows except the top 2 rows using DataFrame.tail(2).
import pandas as pd

student_dict = {'Name': ['Joe', 'Nat', 'Harry','Jack','Jose',"Jill","Rose"],
                'Age': [20, 21, 19,17,18,19,17],
                'Marks': [85.10, 77.80, 91.54,72,87.9,90,72]}

# create DataFrame from dict
student_df = pd.DataFrame(student_dict)

# display top rows except the last 2 rows
bottomRows = student_df.tail(-2)
print(bottomRows)
    Name  Age  Marks
2  Harry   19  91.54
3   Jack   17  72.00
4   Jose   18  87.90
5   Jill   19  90.00
6   Rose   17  72.00
Select bottom rows from the multi index DataFrame#
We can apply the DataFrame.tail() function on multi-index DataFrames as well. It works in the same way as normal DataFrames.
Example:
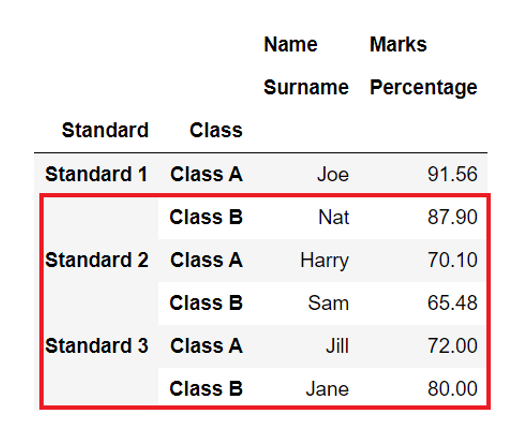
In our example, after we have applied the DataFrame.tail() function, only the bottom 5 row are displayed.
import pandas as pd

index = pd.MultiIndex.from_tuples([('Standard 1', 'Class A'), ('Standard 1', 'Class B'),
                                   ('Standard 2', 'Class A'), ('Standard 2', 'Class B'),
                                   ('Standard 3', 'Class A'), ('Standard 3', 'Class B')],
                                  names=['Standard', 'Class'])

columns = pd.MultiIndex.from_tuples([('Name', 'Surname'),
('Marks', 'Percentage')])

# create multi-index dataframe
student_df = pd.DataFrame([('Joe', 91.56), ('Nat', 87.90), ('Harry', 70.10),
                           ('Sam', 65.48), ("Jill", 72), ("Jane", 80)],
                          index=index, columns=columns)

bottomRows = student_df.tail()
print(bottomRows)
                      Name      Marks
                   Surname Percentage
Standard   Class
Standard 1 Class B     Nat      87.90
Standard 2 Class A   Harry      70.10
           Class B     Sam      65.48
Standard 3 Class A    Jill      72.00
           Class B    Jane      80.00
Select value using row and column labels using DataFrame.at#
There are cases in the field of Data Science that we need to access a specific element of the DataFrame using its column label and row index. In such cases, we can use the DataFrame.at property and pass the row index and column labels of the value to access as parameters. This property can be used with Multi-index DataFrame as well.
Note: It throws
KeyErrorif the label does not exist in DataFrame.
Example:
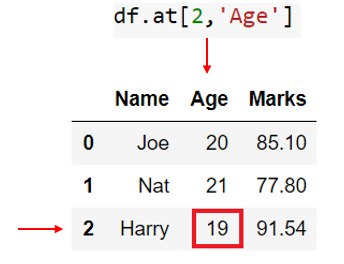
In the below example, after we use the DataFrame.at[2,"Age"] function, we get 19 as the output because 19 is the value present at row 2 and column Age.
import pandas as pd

student_dict = {'Name': ['Joe', 'Nat', 'Harry',], 'Age': [20, 21, 19],
                'Marks': [85.10, 77.80, 91.54]}

# create DataFrame from dict
student_df = pd.DataFrame(student_dict)

value = student_df.at[2,"Age"]
print(value)  # --> Output: 19
19
Set specific value in pandas DataFrame#
When we want to update the value of the particular element from DataFrame based on its column label and row index, we can use DataFrame.at property.
Example:
In the below example, after we have applied DataFrame.at[2,"Age"]=50 on our DataFrame, the value at that position changed from 19 to 50.
import pandas as pd

student_dict = {'Name': ['Joe', 'Nat', 'Harry',], 'Age': [20, 21, 19],
                'Marks': [85.10, 77.80, 91.54]}

# create DataFrame from dict
student_df = pd.DataFrame(student_dict)
print(student_df.at[2,"Age"])

# change the value
student_df.at[2,"Age"] = 50
print(student_df.at[2,"Age"])
19
50
Select value using row and column position using DataFrame.iat#
We want to access a specific element from a very large DataFrame, but we do not know its column label or row index. We can still access such an element using its column and row positions. For that, we can use DataFrame.iat property of python pandas. Unlike DataFrame.at it can work on the row and column index position of the DataFrame.
Note: Index positions starts at 0.
Example:
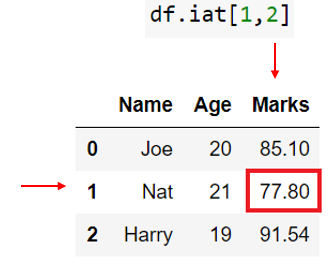
In the below example, we access the second row and the third column using DataFrame.iat[1,2].
import pandas as pd

student_dict = {'Name': ['Joe', 'Nat', 'Harry',], 'Age': [20, 21, 19],
                'Marks': [85.10, 77.80, 91.54]}

# create DataFrame from dict
student_df = pd.DataFrame(student_dict)

value = student_df.iat[1,2]
print(value) # --> Output: 77.80
77.8
Set specific value in pandas DataFrame#
When we want to update the value of the particular element from DataFrame based on its column and row position, we can use DataFrame.iat property.
Example:
In the below example, we change the value at the second row and the third column using DataFrame.iat[1,2]=90.
import pandas as pd

student_dict = {'Name': ['Joe', 'Nat', 'Harry'], 'Age': [20, 21, 19],
                'Marks': [85.10, 77.80, 91.54]}

# create DataFrame from dict
student_df = pd.DataFrame(student_dict)
print(student_df.iat[1,2])

# change value
student_df.iat[1,2]=90
print(student_df.iat[1,2])
77.8
90.0