What is cluster map?#
Plot a matrix dataset as a hierarchically-clustered heatmap.
http://seaborn.pydata.org/generated/seaborn.clustermap.html?highlight=clustermap#seaborn.clustermap
import numpy as np
import pandas as pd
import seaborn as sns
import matplotlib.pyplot as plt

%matplotlib inline
# laod flight data set
iris = sns.load_dataset("iris")
iris.head()
| sepal_length | sepal_width | petal_length | petal_width | species | |
|---|---|---|---|---|---|
| 0 | 5.1 | 3.5 | 1.4 | 0.2 | setosa |
| 1 | 4.9 | 3.0 | 1.4 | 0.2 | setosa |
| 2 | 4.7 | 3.2 | 1.3 | 0.2 | setosa |
| 3 | 4.6 | 3.1 | 1.5 | 0.2 | setosa |
| 4 | 5.0 | 3.6 | 1.4 | 0.2 | setosa |
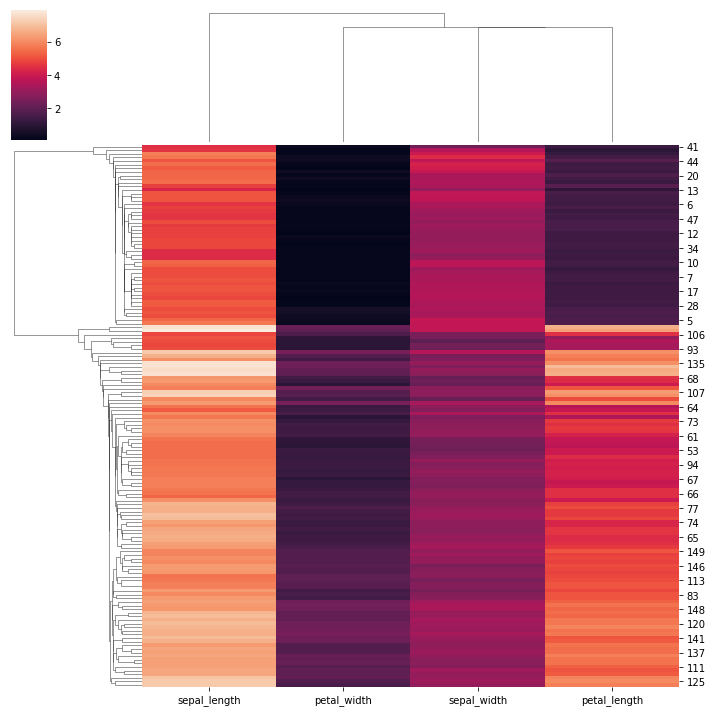
# Plot a clustered heatmap:
species = iris.pop("species")
sns.clustermap(iris)
<seaborn.matrix.ClusterGrid at 0x163cdf926d0>
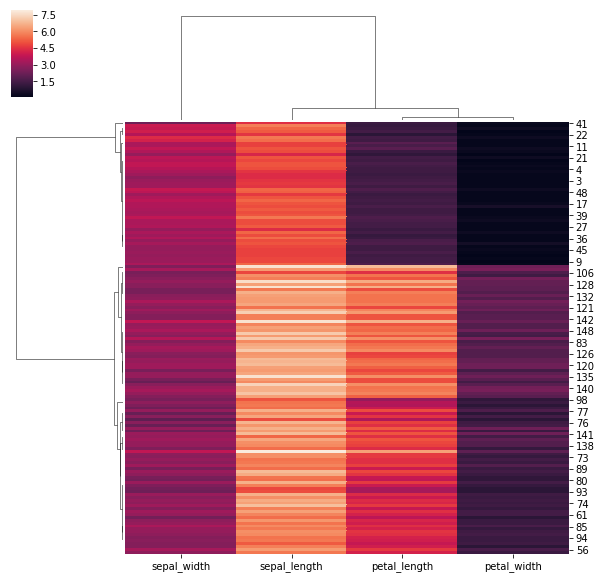
## Use a different similarity metric:
sns.clustermap(iris_data,metric = 'correlation')
<seaborn.matrix.ClusterGrid at 0x1be276a14a8>
# Use a different clustering method:
sns.clustermap(iris,method = 'single')
<seaborn.matrix.ClusterGrid at 0x163ce3245e0>
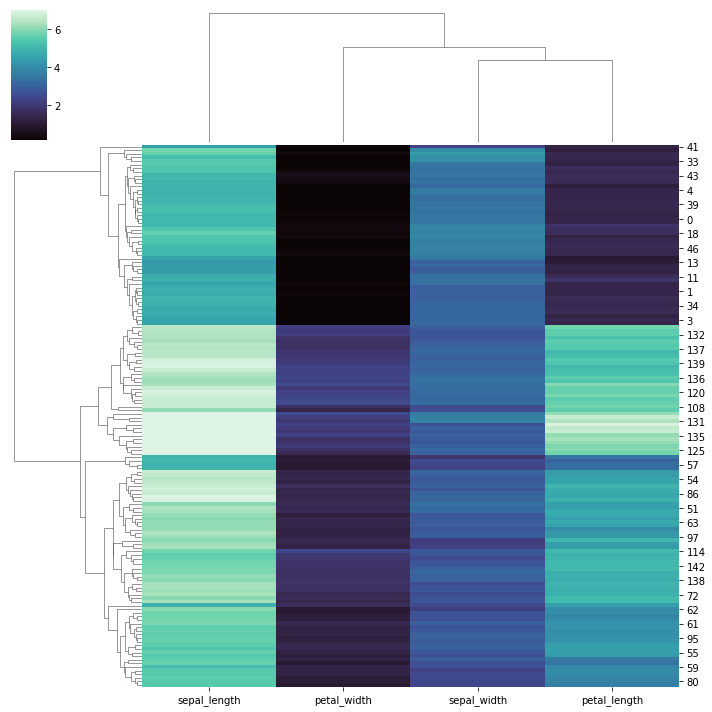
# Use a different colormap and ignore outliers in colormap limits:

sns.clustermap(iris, cmap="mako", robust=True)
<seaborn.matrix.ClusterGrid at 0x163ca247070>
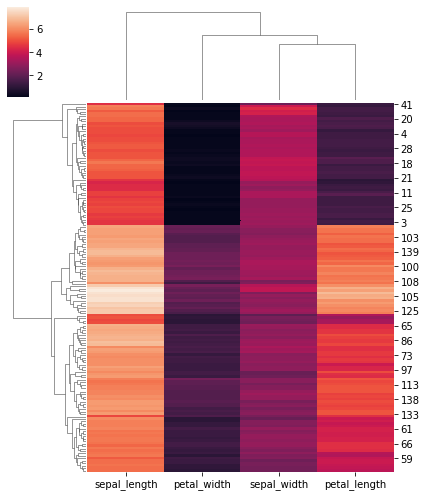
# Change the size of the figure:
sns.clustermap(iris, figsize=(6, 7))
<seaborn.matrix.ClusterGrid at 0x163cfcc79d0>
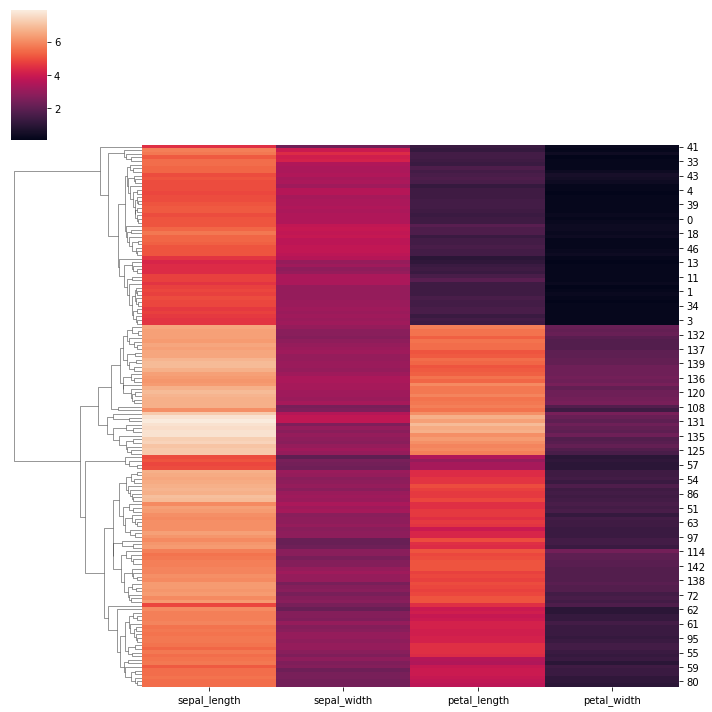
# Plot one of the axes in its original organization:

sns.clustermap(iris, col_cluster=False)
<seaborn.matrix.ClusterGrid at 0x163d0288250>
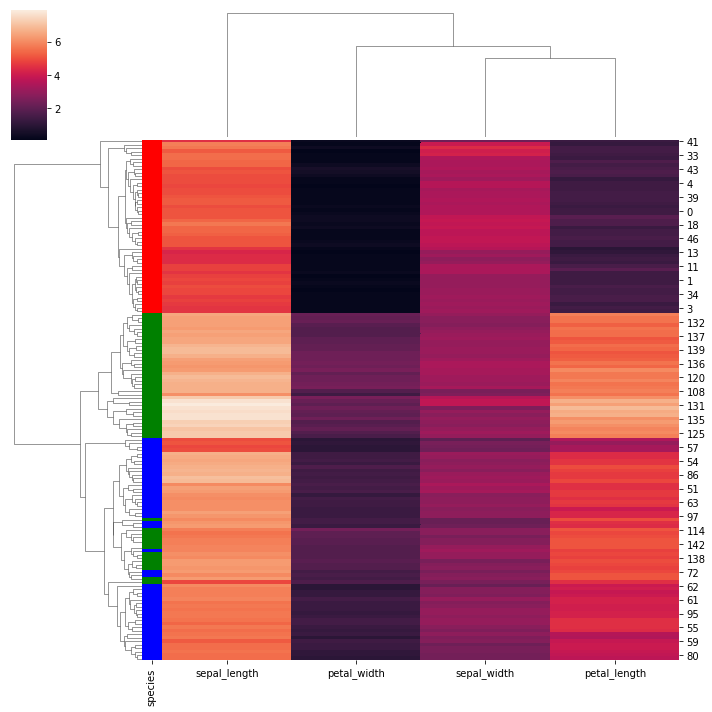
# Add colored labels:

lut = dict(zip(species.unique(), "rbg"))
row_colors = species.map(lut)
g = sns.clustermap(iris, row_colors=row_colors)
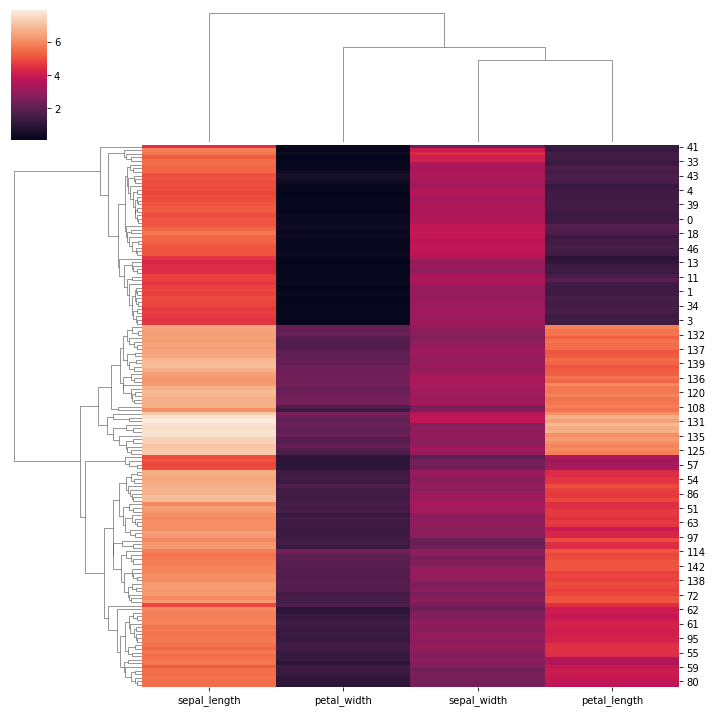
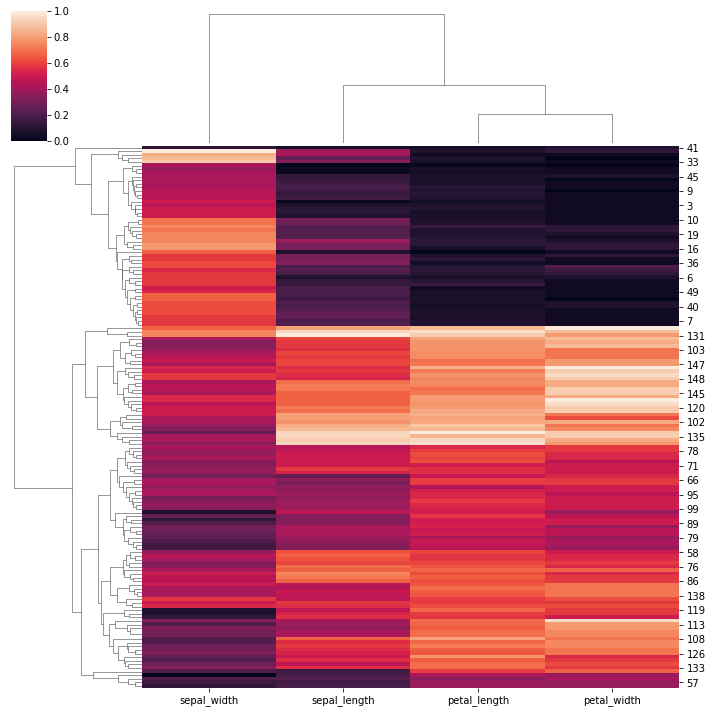
# Standardize the data within the columns:

sns.clustermap(iris, standard_scale=1)
<seaborn.matrix.ClusterGrid at 0x163d05bfa60>
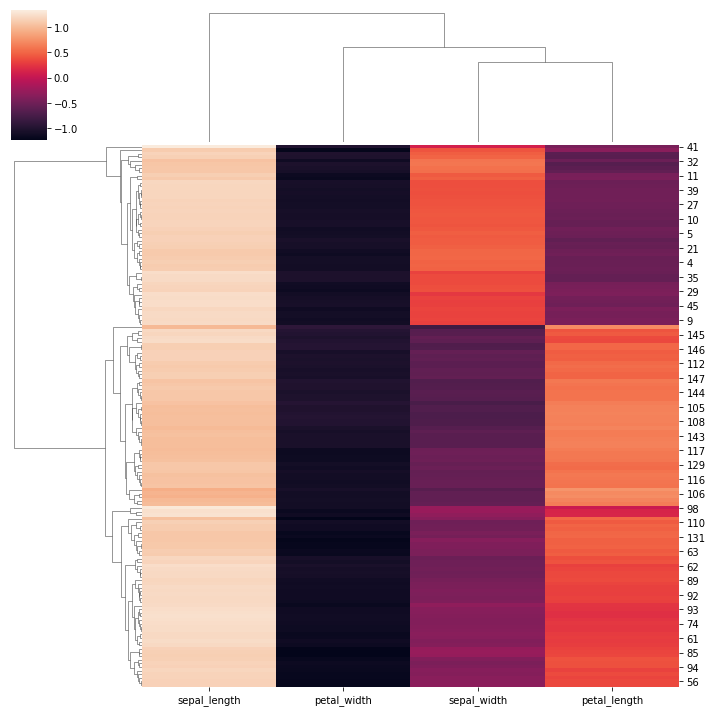
# Normalize the data within the rows:

sns.clustermap(iris, z_score=0)
<seaborn.matrix.ClusterGrid at 0x163d0f2ae20>